The old English saying from playwright John Heywood (16th century) about not being able to enjoy both of two desirable but mutually exclusive alternatives, is upon us now in the 21st century.
Western democracies have (largely) been running big deficits since the Global Financial Crisis (GFC), with some periods of very moderate fiscal austerity over the past 14 years. Without getting “political” here, the simplest explanation for why various levels of governments run deficit financing is that – it buys votes. They supply capital (most would think “free capital”) to all sorts of groups, programs, infrastructure, etc. most of which have a genuine need for government funding, but when that free flowing capital goes nuclear, like it has the past two years, then, Houston, we have a problem and all of a sudden, that free capital doesn’t seem so free any more.
In the following charts, I will show the balance sheets of the Bank of Canada and the US Federal Reserve Board along with the respective amount of Debt Outstanding in each Federal Government. Then we can talk about who pays for this largesse.
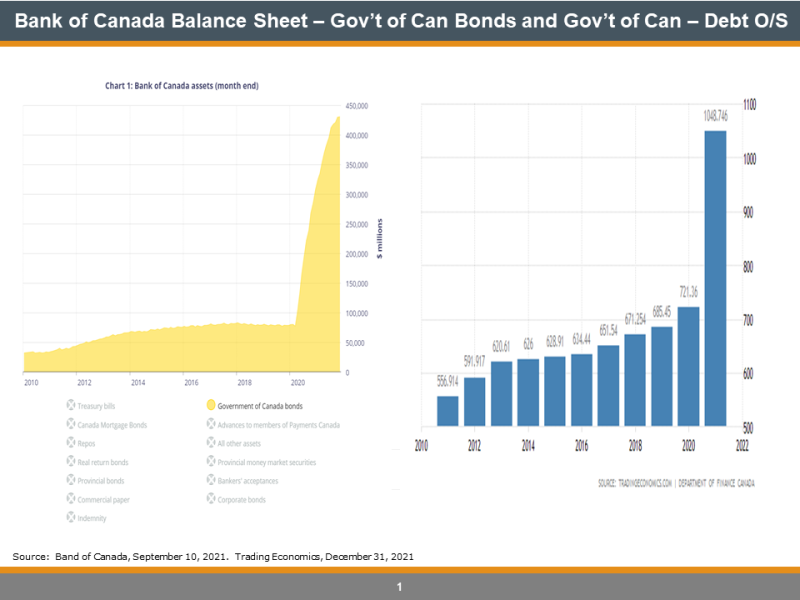
First, the Bank of Canada’s holdings in just Government of Canada bonds, which is about $440bln of their total holdings of $500bln (adding in Repos, T-Bills, Provincial Bonds etc) as you can see on the left. Then the Gov’t of Canada’s Debt Outstanding is on the right. Calculating the increase in The Government’s Debt Outstanding at about $327bln over 2020 to 2021 and then calculating the increase in the BoC’s increase in Government of Canada bonds at $353bln. The timing is a bit off and that may effect the numbers slightly but the takeaway is evident, nonetheless…the BoC basically bought, net-net, all the Gov’t of Can bonds that the Gov’t of Can issued during the past two years. This is called Quantitative Easing and turns Fiscal Policy into Monetary Policy. The Gov’t is effectively using the BoC to monetize their debt/deficits. Also note that the entire BoC Balance Sheet of ~$500bln is about 50% of the entire amount of Gov’t of Can Debt Outstanding. Meaning they own 50% of the bonds outstanding. Stunning.

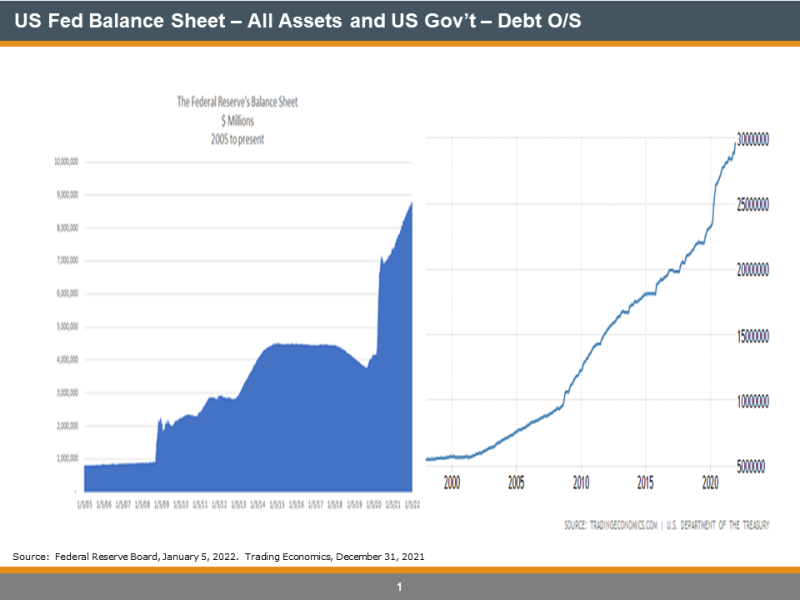
Now if we look at our closest ally, neighbour and trading partner, we can see that the US has had a similar situation develop. In the chart below, you can see that the Fed’s Balance Sheet ballooned from less than $1tln pre-GFC to a stable $4tln in 2015 and then, with Covid-19, grew to a whopping $8.8tln. Unsurprisingly, the amount of US Debt Outstanding has been on a strong upward trajectory for 20 years but with Covid-19, it too went algorithmic hitting darn close to $30tln. So, of the ~$6tln of new US Gov’t debt over the last two years, the Fed bought almost $5tln of it. And on the same metric, the Fed owns about $9tln of $30tln of debt outstanding at the Federal Gov’t, some ~30%, vs Canada’s situation at 50%…bad but not as bad. I suppose it is all relative.

You often hear pundits and people in social conversations saying, “well who is going to pay for all this debt” or it is all OK because of the new-age economic theory that is Modern Monetary Theory (MMT). Regardless of what it is called, the answer is, we are all going to pay for it, but not directly by paying the debt down (it will never be paid back…running balanced budgets will even be decades out; for the system and the wealth effect are too big to contract at this stage), but rather, we are paying for it every day in just about everything we buy – groceries to feed our families, fuel for our cars, natural gas to heat and cool our houses and to charge our EV’s, lumber to build homes or do renos, labour to do the work, stocks and corporate bonds we invest in and the most topical right now, housing. Pick an asset, and it has inflated in price in a huge way. That is the cost of deficit financing…it erodes the purchasing power of the currency and inflates the value of any asset priced in $’s, which is everything.
And our economy is so “productive” (due to technological advances and about to get more so with robotization) now, that wages have not kept up. For instance, thirty years ago a 25 year old college grad would have made about $60,000 per year and the average semi-detached three bedroom starter home in Toronto would have cost them about $250,000, which was 4.2x their gross income. Today, that same 25 year old might make $75,000 while that same house would cost $1,800,000, representing 24x their gross income.
The net effect of deficit financing is we are all paying more to live. It is all over the financial and nightly news and it is commonly called, “inflation”. Covid-19 was the latest reason for the ballistic deficit financing but this has been building for 25 years in Canada (recall that during the Chretien gov’t in the early/mid 90’s, we had a run on the C$ so he had to answer that with fiscal austerity). But with every western democracy running massive deficits, it is effectively Global Competitive Deficit Financing and unless one nation goes way off course from the others, they are all in the same boat. So long as there is no “run on the currency”, these deficits will continue. The other net effect of massive deficit financing comes in the form of what I call Hyper Asset Price Inflation, which simply means that those who own assets (investments, housing, commodities, etc) benefit enormously and, those who don’t, suffer. This creates a further Wealth Gap between the Haves and Have Nots. This is most apparent in the two asset classes of residential real estate and investment portfolios. Sadly, our public policy makers do not seem to get this relationship between deficit financing and hyper asset price inflation and they believe that massive deficit financing will somehow fix the problem. It won’t fix it, but what it will do is…make it worse.
In addition to all this deficit financing creating inflation, we now have supply chain disruptions, which we have all heard about due to Covid-19 protocols at factories, ports and egress points. This should be an easier fix and hopefully abates as Covid-19 fades into the rearview mirror.
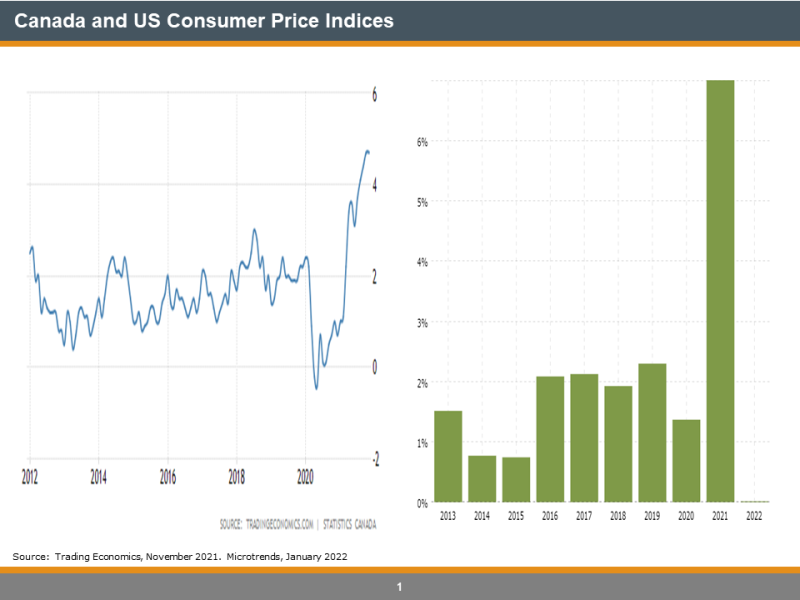
A simple chart showing Consumer Price Inflation in both Canada and the US.

And these CPI charts only tell part of the story. God help us if we are forced to do basic maintenance on our home and we need to buy lumber (2×4’s hit all time highs last week).
Let’s hope this inflation is “transitory” as many politicians and central bankers think/hope/pray it is. But even if it is and CPI goes back to 2%, with deficit financing, one will still want to own assets.
We can’t have our cake and eat it too. We all end up paying one way or another.

