Gov’t bond yields have been rising substantially as investors worry about all the monetary and fiscal stimulus leading to inflation.
Perhaps another day we could write about the effect of all this stimulus on Money Supply, GDP, the Velocity of Money and the Multiplier Effect but suffice to say that as much as Money Supply (M2) has increased, the Velocity of Money has decreased, thereby and arguably, limiting the potential effects of all that stimulus turning into inflation. It is much more complicated than that, but for today, that is it. For now, it is not a foregone conclusion that we will see inflation any time soon.
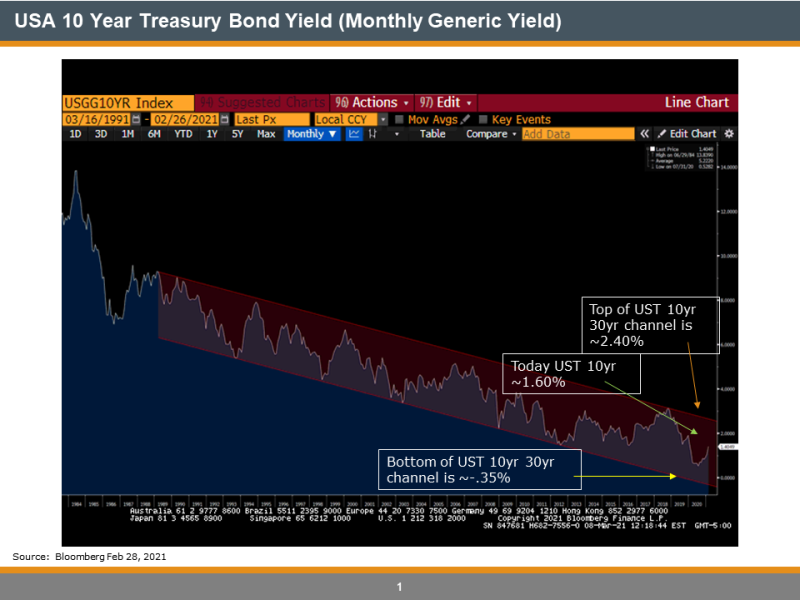
Given that, here is a simple look at the long-term chart of the US 10yr Bond Yield over about the last 30yrs (Source: Bloomberg). You can see in red the downward sloping channel with the high end of that channel around 2.40%, the current level around 1.60% and the low end of the channel around -0.25%. Could the market still move to negative rates? Although it doesn’t feel it right now, it is possible. I think for that to happen, we would need to see a couple of things occur: 1) a large sell-off, for whatever reason, in risk assets (stocks) and 2) all measures of inflation (employment, hourly earnings, commodity prices etc.) begin to trail off (and some, like David Rosenberg, would argue some metrics already are trailing off).
Anyway, here is the chart to track for the next couple of quarters:

And the picture is of our 1.75 year old Dakota Sport Retriever, Hudson, who tried to “retrieve” some live ducks in Lake Ontario during the cold snap and all he got was icicled fur.

