Government bond yields have backed up in most countries (Canada and the USA, which concern us most) in the five year to the thirty year part of the bond curve, which goes from overnight out to thirty years in maturity. For sure, central banks are not raising short term (overnight) rates any time soon. The risk of all this Quantitative Easing, fiscal stimulus etc. is that inflation may surface like a disease…whether it does or doesn’t is a different story. Right now, the perception is that it just might and perception, as they say, is reality.
So, the reality is we have had a substantial move higher in government bond yields/interest rates. The one effect I wrote about on Feb 16th here is that as the discount rate (interest rate used to calculate future cash flows) goes up, the value of those future cash flows today goes down…so does the stock price. See high growth mega-cap companies like AMZN, FB, GOOG, etc.
The other effect of higher interest rates is on the stock market (and the economy) in general. With regards to the economy, higher rates affect everything from car loans, to leases, to mortgage payments, etc. With regards to the stock market, higher rates affect it in two ways: 1) a higher discount rate means future cash flows today are worth less (see above) and 2) they offer an alternative investment…remember the acronym TINA…”There Is No Alternative because rates are so low so I have to buy stocks to make a decent return”? Well as rates rise, all of a sudden, investors have options and will start looking at a government guaranteed return as “not bad” risk to take.
So how high do yields go and when do they start affecting stock market prices? Everyone everywhere is now asking this question.
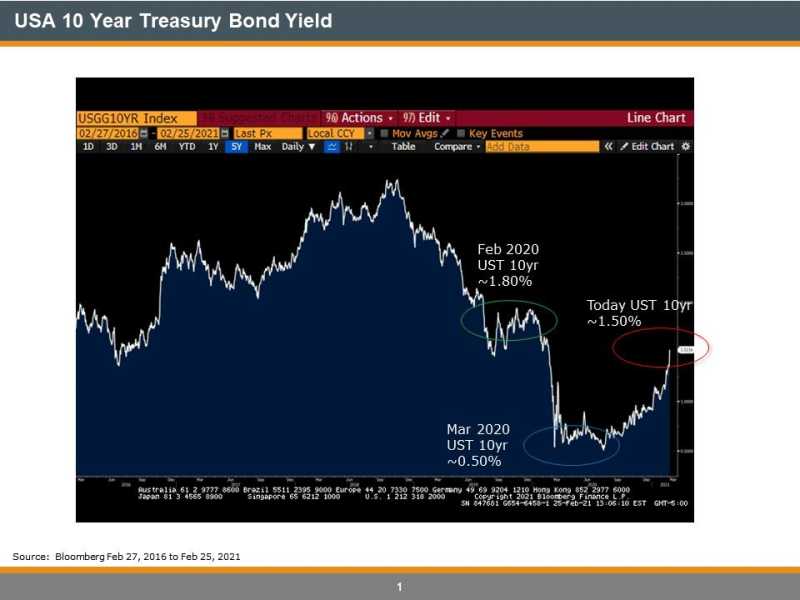
Looking at the USA 10yr Treasury Bond Yield vs the S&P 500 Dividend Yield can give us a clue about where to from here. Below is the USA 10yr T Bond over the last 5yrs. Note – in Feb 2020 it sat at ~1.80%, dropped to ~.50% in March on a flight to safety and then has ramped up to ~1.50% since with much of the move coming over the past two months.

Now let’s look at a chart of the S+P 500 Dividend Yield over the same time frame. Note – in Feb 2020 sat at ~1.80% (same as the UST 10yr), then rose dramatically (stocks sank so dividend yield rose) to 2.60% before the strong stimulus-induced rally in stocks bringing the dividend yield back to par with the UST 10yr yield at ~1.50%

Conclusion – To be honest, I don’t know what is about to happen but my gut tells me that at 1.50% in UST 10yrs, there will be some money that finds that level an attractive investment (think pension funds etc.). Now there are times when the Dividend Yield is substantially lower than the Bond Yield so this is just an observation in recent time that is shown by the two graphs but the last time they sat on top of each other like that, something bad happened.
*NB – our new website requires that each blog have an “image” at the top. Scott uses some great cartoons but I might just use pictures. Can anyone guess where this picture was taken? (Hopefully the market won’t look as bleak!).

