By now, most everyone knows that global central banks and governments have “primed the pump” with money (liquidity/stimulus) over the past year to combat the economic and personal affects of Covid-19. Large swaths of the global economy were shut down, leaving hardship for many.
In the USA for example, the Federal government has added about U$6 trillion in fiscal stimulus. Couple that with the Federal Reserves balance sheet (monetary stimulus) going from U$4 trillion pre-Covid to U$8bln today and you have a total of about U$10 trillion in stimulus, which is about half of their annual GDP for a single year! Suffice to say, that is a lot of dough.
And Canada just unveiled its first budget in two years. And what a budget it was at -$500 billion across the Covid period. Add some monetary stimulus on behalf of the Bank of Canada and it looks similar to the USA on percentage terms (maybe worse, given our economy is still somewhat shut due to the lingering effects of Covid).
But where has all money gone? We will look at a series of charts to find the money trail.
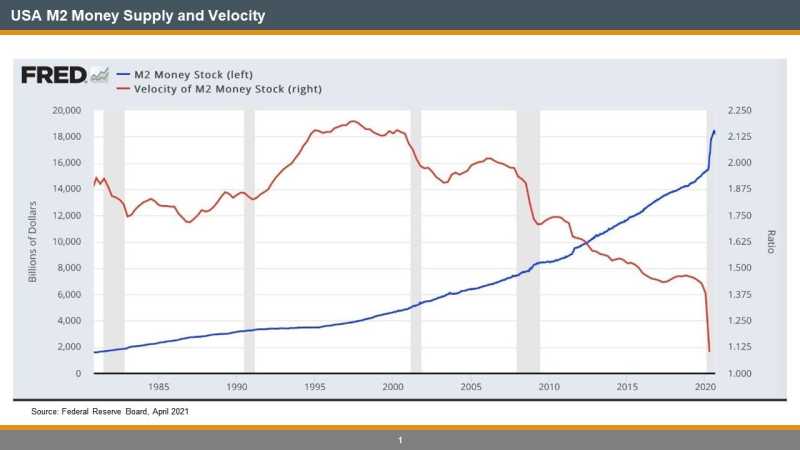
The first chart shows the supply of money, most commonly measured by M2 (blue line), which measures the supply of money in the system, including cash, chequing deposits, and money market instruments. We all know it increased massively. But M2 only tells half the story. The other half of the equation to create economic growth is how many times the M2 turns over in the economy (the ratio of GDP/M2). This is called the Velocity (red line) of M2. Easy to see that as much as M2 rose, Velocity declined telling us the net effect on economic growth has been negligible.

So what happened to all that money?
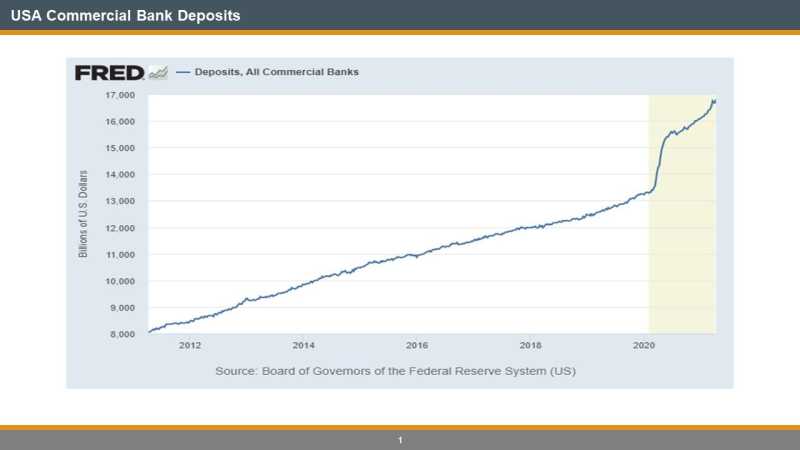
Next, we should look at US Bank Deposits which reflects new cash being deposited at banks from both fiscal and monetary stimulus.
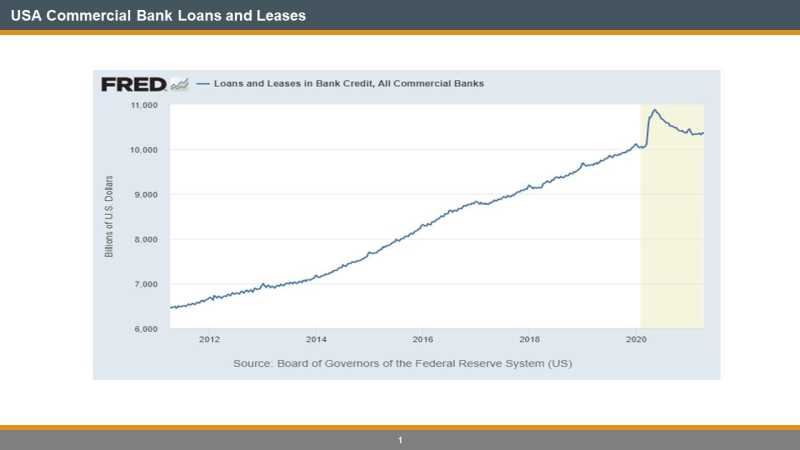
What we know so far is that there has been a lot of money put into the banking system which shows up on the bank’s balance sheets as deposits but that money appears to be sitting there, not “turning over” in the economy or being terribly productive. Normally, banks would lend this money out to businesses and consumers. But looking at Loans and Leases (one of the largest and important categories), it doesn’t seem to be the case. Banks clearly are not keen on taking credit risk right now but they may be forced to at some point. Their earnings the past week were stellar but only as it relates to capital markets and asset management activity.

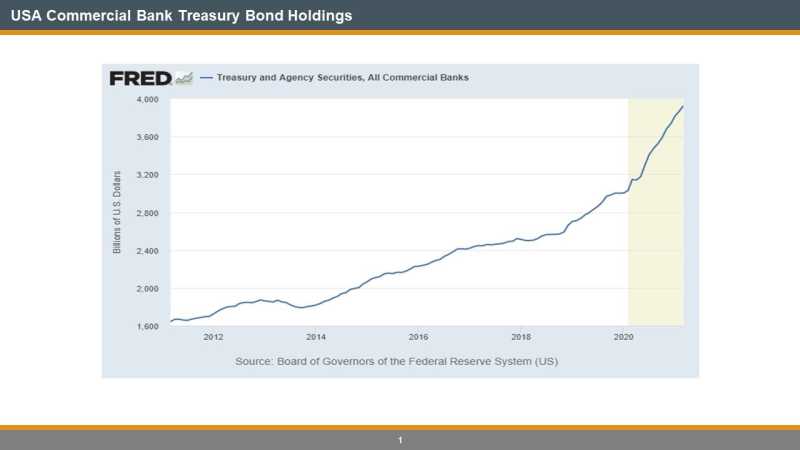
So, the banks are sitting on this money? Not quite. Ever wonder who is buying US Treasury Bonds with such low yields?

And where else did all the $10 trillion go? If there has been no consumer inflation, there sure as heck has been massive asset price inflation. Stocks, Corporate Bonds, Bitcoin, Housing…insert your own chart here. This is where the money went…not to productive means in the economy, like the policy makers may have hoped. I will use the S+P 500 as a measurement tool.

The end result, massive asset price inflation, no consumer inflation, no economic growth, and a wealth gap that has increased (and will continue to increase the more these governments throw unproductive money into the system). The more these governments/central banks deficit finance, the more we will see asset price inflation as all they are doing is devaluing the currency.
I am led to believe that either these politicians are economic illiterates or are buying a lot of votes for the next election cycle.

